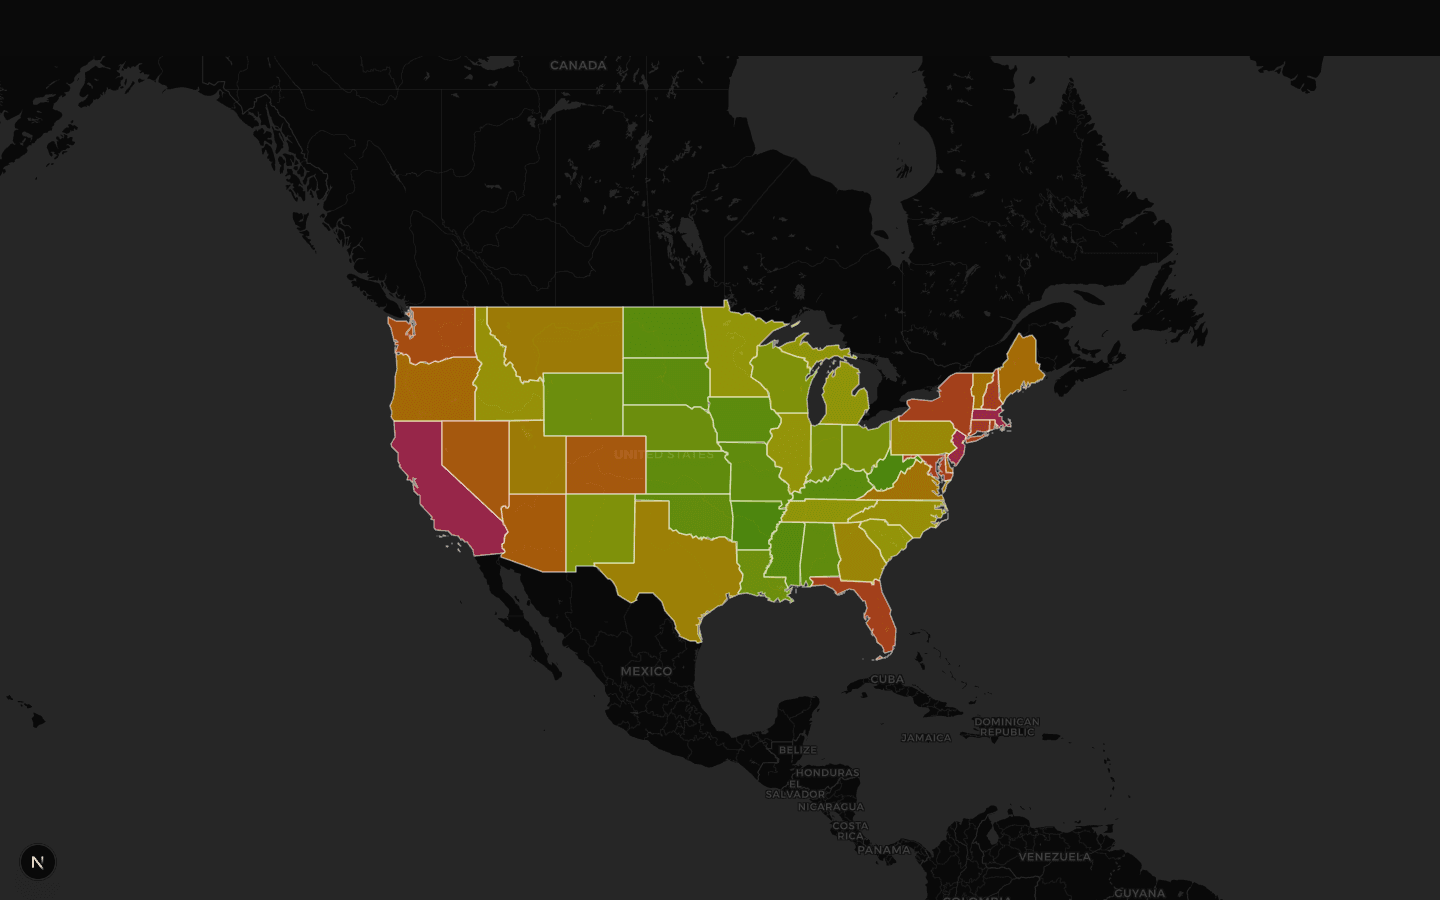
Fair Market Rent, with ZIP-level clarity.
Search an address, city, state, or ZIP. Compare bedroom sizes and see 90% and 110% payment standards without digging through spreadsheets.
Coverage
State, county, ZIP views
Standards
90% and 110% bands
Trends
FY2022-FY2026 history
Workflow
Built for decisions, not dashboards.
The map is fast, direct, and grounded in HUD SAFMR data. Find the place, match the unit, and read the ranges that matter.
Search any location
Type an address, city, state, or ZIP to jump to the data.
Match the unit
Toggle bedroom size to line up with the unit you are reviewing.
Check payment standards
Compare base SAFMR with the 90% and 110% payment ranges.
Use cases
Answer real questions in minutes.
What is the voucher range for this ZIP?
See the base SAFMR alongside 90% and 110% standards in the detail panel.
How is this area trending?
Open the trend view for FY2022-FY2026 to spot momentum.
How do boundaries change the story?
Zoom from state to county to ZIP, or toggle territories when needed.
Built for
Teams who need HUD data fast.
Whether you are pricing units, validating standards, or writing a brief, the map keeps the baseline in view.
Housing authorities
Compare payment standard ranges across jurisdictions.
Landlords and property managers
Anchor asking rents to HUD SAFMR baselines.
Investors
Scan FMR signals before deeper underwriting.
Researchers and advocates
Trace rent pressure across regions with consistent data.
Ready to explore
Open the heat map and start with a ZIP.
HUD SAFMR data, rendered in seconds, with trends and payment ranges.